Introduction
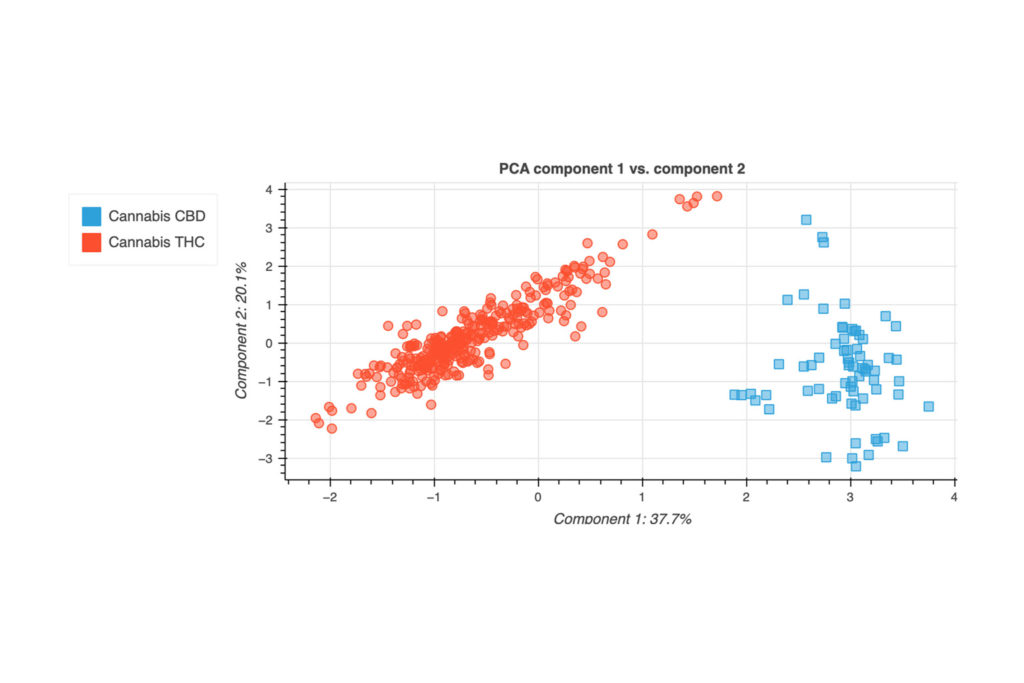
Cannabis sativa L. has one of the most controversial histories in our society. After many decades of prohibition, due to the presence in its inflorescences of the psychotropic Δ9-tetrahydrocannabinol (THC), nowadays its possible therapeutic role is getting attention from the scientific community. It follows that many countries are legalizing cannabis products containing THC for recreational and medical use. In parallel, another cannabinoid, naturally synthetized by the plant, is currently under the spotlight: cannabidiol (CBD). According to the legislation of most countries in Europe, cannabis with a THC content higher than 0.2-1% (depending on the country) is classified as illicit drug.
On the other hand, CBD has not a psychotropic effect and cannabis with various contents of CBD can be easily found in dedicated shops. This type of cannabis is named “CBD like” to be distinguished from the illicit one, “THC like”. It is clear that the coming of these products in the legal market poses challenges to the police force to distinguish between licit and illicit cannabis when frisking a suspect. The need for a proper analytical tool to be quickly and easily applied by the police is a direct consequence of this problematic.
Handheld near infrared (NIR) spectrophotometers implemented with a suited chemometric model look to be the best analytical solution. In fact, this user-friendly technique allows acquiring both qualitative and quantitative information about the sample directly on the field of interest [1, 2]. In this context, the development of a quantitative analytical method based on NIR spectroscopy to determine the THC content in cannabis sample was the object of this study.
Material and methods
Cannabis samples containing different amounts of THC were provided by the School of Criminal Justice of the University of Lausanne. Cannabis inflorescences were analysed in three different physical forms (entire, crushed, and sifted inflorescences). Two different handheld spectrophotometers, the low cost NIR-S-G1 (Tellspec, Canada) and the high cost MicroNIR spectrophotometers (Viavi Solutions, California), were used to perform NIR analyses with the aim to compare the performance of both equipment.
The data were acquired in the 950 – 1650 nm (10526 – 6060 cm-1) wavelength range and five spectra were acquired for each sample. Acquity UPLC system coupled to UV detector (Waters, Massachusetts) was used as a reference technique to quantify THC in the samples in order to calibrate and validate the model. Matlab R2018a software (The MathWorks, Massachusetts) and PLS toolbox® (version 8.6.2, Eigenvector Research, Washington) were used for data treatment and computation.
Results and discussion
Six different Partial Least of Squares (PLS) models were built by using the spectra collected with the two selected NIR instruments. Since the homogeneity of the samples can impact the sampling representativeness and consequentially the predictive performance of a model, the spectra were acquired on cannabis inflorescences in three physical forms (entire, crushed, and sifted) in order to study this aspect.
In fact, cannabinoids are not uniformly present on inflorescences: they are more concentrated in the external parts of the inflorescences and less in the internal branches. This fact can easily lead to misestimate the real percentage of THC and be an important source of error if not taken into consideration.
For each cannabis form, a specific model was built with the aim to determine the THC content in the samples and easily individuate “THC like” cannabis. Ideally, the privileged cannabis form on which to build the model is represented by the entire inflorescences. Indeed, this is the most common form of cannabis sequestered by police in the street and does not require any sample preparation. The calibration set consisted in different samples covering a relatively wide concentration range from 0.92 to 22.21 % of THC. An external validation set was built to evaluate the predictive performance of each model. The chemometric models were then compared to choose the best suited instrument and model based on the method purpose.
Conclusion
The application of NIR spectroscopy to cannabis samples analysis showed to be suitable from an analytical point of view. The PLS models allowed to predict the THC content in samples of cannabis inflorescences with an established precision. Moreover, handheld NIR spectrophotometers, allowing to perform analyses directly on the field of interest, make this method useful for out-lab analyses, such as for police controls.
References
[1] Deidda, R., Sacré, P.-Y., Clavaud, M., Coïc, L., Avohou, H., Hubert, Ph., Ziemons, E. Vibrational spectroscopy in analysis of pharmaceuticals: Critical review of innovative portable and handheld NIR and Raman spectrophotometers. Trends Anal. Chem. 114, 251 – 259, 2019.
[2] Sánchez-Carnerero Callado, C., Nuñez-Sánchez, N., Casano, S., Ferreiro-Vera, C. The potential of near infrared spectroscopy to estimate the content of cannabinoids in Cannabis sativa L.: A comparative study. Talanta 191, 147 – 157, 2018.