When we talk about classification problems, we’re essentially asking a model to decide: “Which group does this item belong to?”
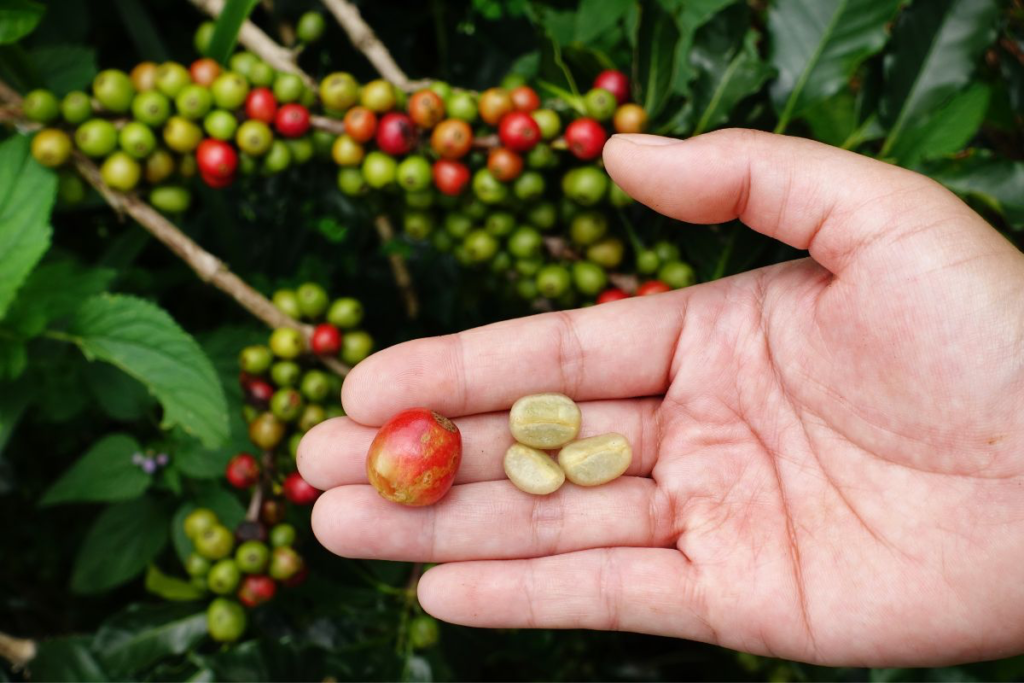
Unlike prediction problems that estimate continuous values, classification focuses on discrete categories, such as whether a product is genuine or counterfeit, or whether a plant is ready to harvest or not.
At the core of classification is the idea of differentiating classes. To do this effectively, we must determine what features make one class different from another. These features are the measurable signals, patterns, or properties that help the algorithm separate one group from another. In the case of NIRLAB, the features are derived from the NIR spectra, and through data processing and chemometric analysis, we identify the underlying patterns and properties that differentiate classes.
How Classification Works
A classification algorithm learns to distinguish between categories by analyzing labeled data. This means we provide the model with input data (signals, measurements, or observations) along with labels that define which category each example belongs to.
By doing so, the algorithm can identify the features that are most strongly associated with each label.
In short, the process works like this:
- Feature Extraction:
Identify measurable attributes of the data that capture important differences between classes. - Training:
Use the labeled examples to teach the algorithm how to recognize patterns that belong to each class. - Decision Boundary:
The algorithm determines a “line” (in simple cases) or a more complex boundary in multi-dimensional space that separates one class from another. - Prediction:
For new, unseen data, the model uses what it has learned to decide which class it most likely belongs to, often supported by confidence scores or other evaluation metrics.
Common Classification Algorithms
There are many different algorithms/mathematical models that can be used for classification, each with its own strengths and weaknesses.
Logistic Regression
Logistic regression models the probability that an observation belongs to a class (say, genuine vs counterfeit). Mathematically, for binary classification problems, it uses the sigmoid function which converts input data into a probability.

Here, the features [x1,x2,x3,…,xn] are weighted by coefficients [β] that the model learns during training. If the probability is for example above 0.5, the model classifies it as one class, otherwise, the other.
Decision Trees & Random Forests
A decision tree splits data step by step, asking questions based on feature values. The mathematics is based on information gain or Gini impurity, which measures of how well a split separates classes in other term how good is the question to separate a class.
For example is you want to tell wheat from corn with the nirlab solution, if we ask “Is the grain more yellow than brown?”, most corn (yellow) goes into one group and most wheat (light brown) into another, making the groups pure and giving a low Gini impurity. But if we ask “Is the grain slightly shiny?”, both wheat and corn are mixed together in each group, keeping the Gini impurity high. The tree prefers questions that reduce Gini impurity, because that means the split separates the classes better.
For example, Gini impurity is:
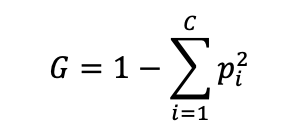
where [ pi ] is the proportion of samples in class [ i ], and [ c ] is the number of classes. A good split is one that reduces impurity the most.
Random forests combine many trees trained on random subsets of data and features, then aggregate their votes. This reduces variance and avoids overfitting, giving more accurate and reliable predictions than a single tree.
Support Vector Machines (SVMs)
SVMs try to find the optimal hyperplane that separates classes. SVMs try to find the optimal hyperplane that separates classes. In other terms, it searches the best line (in 2D), plane (in 3D), or more generally, a surface in higher dimensions that divides the data points into their correct categories. The decision boundary is this hyperplane: points on one side belong to one class, and points on the other side belong to the other class. The decision boundary is defined as:

where [w] is the weight vector (orientation of the boundary), and [b] is the bias (offset). SVM optimizes [w] and [b] to maximize the margin while minimizing classification errors.
Neural Networks
Neural networks apply successive linear transformations followed by nonlinear activations. In other words, think of a neural network like a carefully structured recipe. Each layer represents a step where input signals are combined in specific proportions (the linear combination) and then evaluated or adjusted according to a defined rule (the nonlinear activation) to determine the next course of action. By iterating through multiple layers, the network progressively refines these patterns, ultimately classifying a sample, for instance, identifying whether an explosive is TNT, RDX, or PETN based on its NIR spectral data (add link to publication). A simple layer looks like:

where [W] is a matrix of weights, [b] is a bias vector, and [f ] is a nonlinear activation function (like for example sigmoid). By stacking layers, the network can model very complex functions.
Each of these algorithms has a different mathematical foundation, but they all share the same goal: mapping features to class labels in the most reliable way possible.
Feature Extraction with Near-Infrared (NIR) Spectroscopy
A powerful example of feature extraction comes from Near-Infrared (NIR) Spectroscopy. NIR measures how materials absorb light at specific wavelengths, producing a spectrum that reflects the chemical and physical composition of the sample. In the NIRLAB setup, we typically use the wavelength range from 950 to 1650 nm, which provides a rich window for capturing absorption features relevant to many materials.
For classification, we can extract measurable features from the spectra that capture the differences between classes. Common features include:
- Peak intensities: the strength of absorption at key wavelengths
- Spectral shape or slope: overall trends in the spectrum that indicate material properties
- Ratios of absorbance bands: relationships between different regions of the spectrum
- Derivative features: subtle changes in the spectral curve that highlight small but important differences
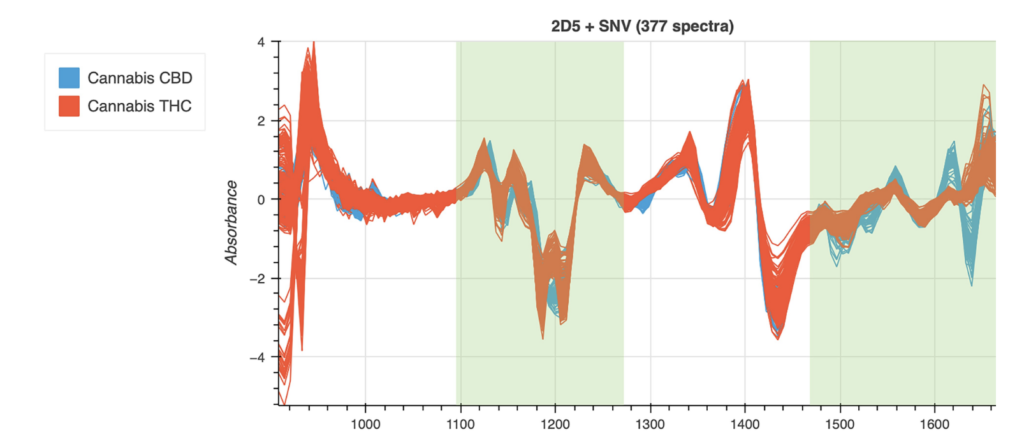
Several factors influence these spectral features, to only mention a few, there is for example Moisture content, Chemical treatments or Material composition.
By capturing these subtle yet measurable differences NIR spectra, we provide a set of features that can be fed into a classification algorithm, allowing the model to learn how to separate classes with precision.
Material Classification with NIRLAB
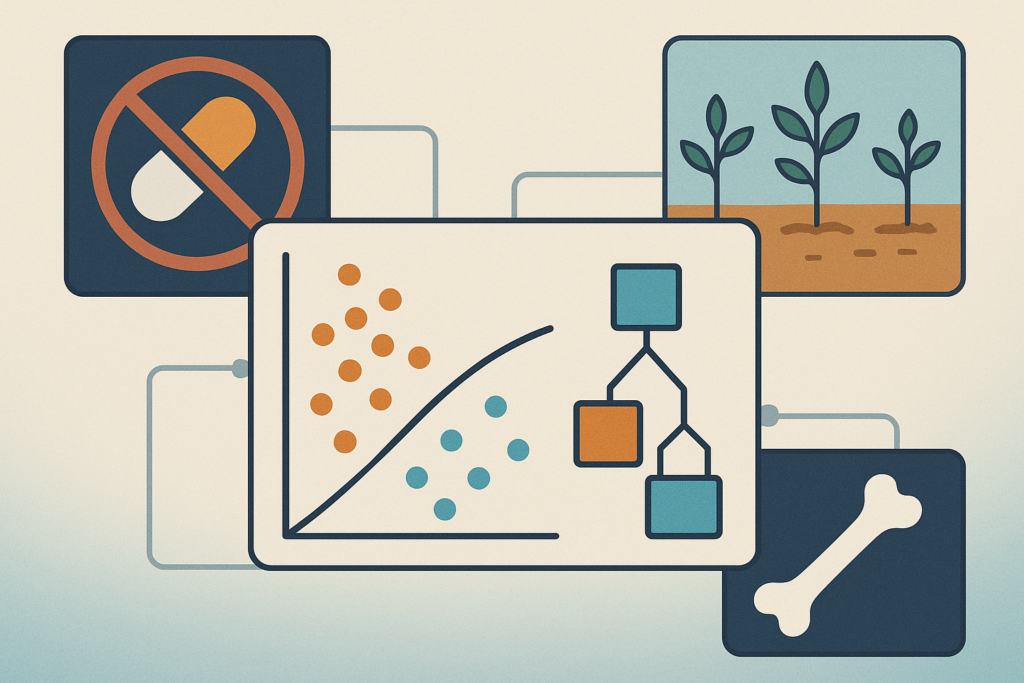
Classification algorithms, combined with NIR spectroscopy, can be applied to a wide range of real-world problems where distinguishing between categories is critical.
Counterfeit Goods: Genuine or Not
Counterfeit detection is a growing application of classification. NIR spectroscopy can reveal subtle differences in chemical composition between authentic products and their fake counterparts. This could be the case for example for the differentiation of
- Genuine leather vs synthetic “plastic leather” or
- Authentic medicines vs counterfeit medicine
By learning from these spectral features, a classification model can reliably determine whether a product is authentic or fake. For example, NIR spectroscopy has been successfully used to detect counterfeit Viagra tablets by identifying differences in the chemical fingerprint compared to genuine tablets. To learn more, check out our blog post discussing the publication by Hervé Rais using the NIRLAB solution here.
Treated vs Untreated Materials (Wood, Paper, Plastics)
NIR spectroscopy can also distinguish between treated and untreated materials. Chemical treatments, such as preservatives in wood or plasticizers in plastics, alter the absorption patterns in the spectrum. Classification models can use these features to identify for example:
- Treated vs untreated wood or paper
- Ripe vs not ripe fruits
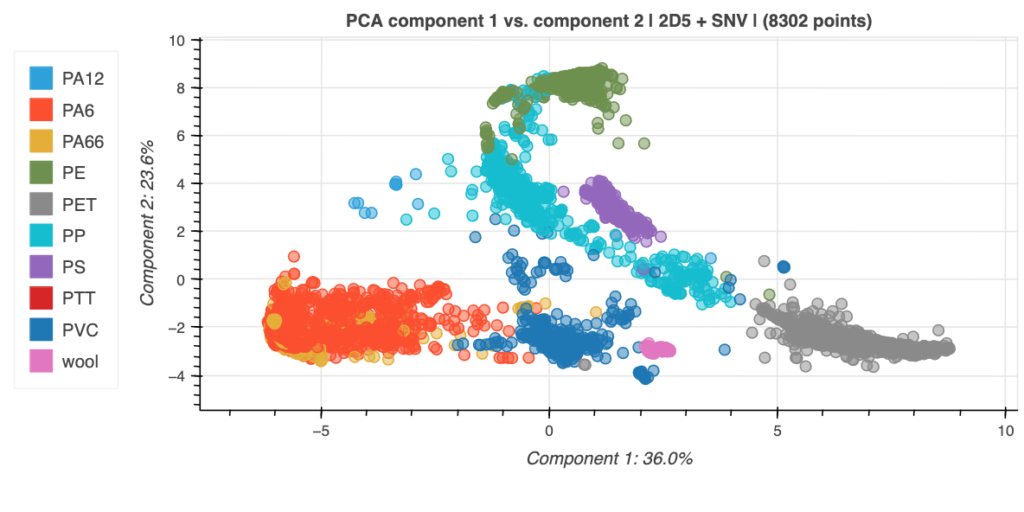
- Differentiate between different polymer types
This capability is particularly valuable in recycling and circular economy applications or for quality control, where correctly sorting materials based on their treatment or chemical composition is essential for safe and effective reuse. To learn more, check out our blog post about plastic recycling: here.
Conclusion
Classification in machine learning is all about drawing boundaries between categories based on features. In practice, for NIRLAB this means identifying the signals or patterns that best distinguish one class from another leveraging NIR spectra.
By combining domain knowledge, such as spectroscopy, with robust classification algorithms, NIRLAB can tackle a wide range of real-world challenges, including:
- Detecting counterfeit goods, such as medicines, branded products, or luxury item: here.
- Differentiating treated vs untreated materials, including wood, paper, plastics, or recycled products
- Distinguishing cannabis products, such as THC-dominant vs CBD-dominant strains: here.
- Identifying human vs animal bones in forensic or archaeological investigations.
- Detecting contaminated fuels or liquids, such as adulterated gasoline.
- Sorting plastic types for recycling or quality control: here.
To learn more about spectroscopy and the full capabilities of NIRLAB’s technology, we invite you to explore our other informative articles here.
Facing specific classification challenges in your industry? Don’t hesitate to reach out to us at contact@nirlab.com . We are happy to discuss your project and develop a solution tailored to your needs.

