When we talk about regression problems, we’re asking a model: “How much of this property is present?”
Unlike classification, which assigns items to categories, regression predicts continuous values, such as fat in olives, moisture in meat, or the concentration of an active ingredient in a medicine.
At NIRLAB, predictions are based on features extracted from NIR spectra. Each spectrum contains subtle variations that reflect the composition of the sample. Using data processing and chemometric analysis, we identify the patterns that correlate with the property of interest.
Rather than separating classes, regression models the relationship between spectral features and quantitative values
How Regression Works
A regression algorithm learns to estimate continuous values, whereas a classification algorithm assigns data to discrete categories. Both use labeled data, but the goal and output are fundamentally different. In regression, we provide the model with input data (signals, measurements, or observations) along with reference values for the property we want to measure. To achieve the most accurate and reliable quantification model, it is crucial to use the best possible reference method when obtaining these reference values, as the quality of the reference data directly determines the model performance. Furthermore, the reliability of the reference variable depends not only on accuracy but also on the range of the values. If the range is too narrow, the model may fail to detect significant variations in the input signals; conversely, if the range is too broad, non-linear effects may become dominant, making it harder for the model to learn consistent relationships and potentially reducing its predictive performance. The algorithm then identifies which features are most strongly associated with changes in that property.
In short, the process is really similar to the classification but like this:
- Feature Extraction: Identify measurable attributes (in the case of NIRLAB, it’s the whole NIR spectra or part of the NIR spectra) of the data that correlate with the property of interest. Unlike classification, where features separate classes, here they explain variation in a quantity.
- Training : Teach the algorithm how changes in the features correspond to changes in the target value.
- Modeling the Relationship: Regression focuses on establishing a mathematical relationship (Linear or non-linear) between features and the property. In contrast, classification focuses on finding a decision boundary that separates one class from another.
- Prediction: For new data, the model estimates a continuous value rather than choosing a category.
In regard to classification, the main difference lies in step 3. In classification, the algorithm focuses on separating classes by finding boundaries between them, essentially asking, “Which category does this sample belong to?” In regression, the focus shifts to quantification, modeling how the features relate to a continuous property, asking, “How much of this property is present?”
In the NIRLAB solution, this allows rapid, non-destructive quantification of fat, protein, moisture, active ingredients, or chemical components directly from spectral data.
Common Regression Algorithms
To use NIR spectroscopy to predict chemical or physical properties requires regression methods capable of handling high-dimensional, highly correlated spectral data. While simple linear regression can handle, in theory, hundreds of wavelengths, the correlation between the regressors is extremely strong, so advanced algorithms are needed. These methods can reduce dimensionality, mitigate multicollinearity, or extract meaningful latent information from the spectra.
In classical chemometrics, the relationship between spectral absorbance and concentration is often assumed to be linear, in accordance with Beer–Lambert law. As a result, many widely used NIR models focus on addressing multicollinearity and dimensionality, rather than explicitly modeling nonlinear effects.
When the linear assumption is valid or approximately valid, latent-variable regression methods such as PCR and PLS are often sufficient and highly effective. However, for complex samples where scattering effects, chemical interactions, or matrix heterogeneity introduce nonlinear behavior, more flexible nonlinear models may be required.
Linear regression methods
Principal Component Regression (PCR)
PCR reduces the spectral matrix X into principal components T that capture the largest variance in the spectra:
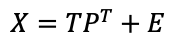
Here, P contains the loadings and E is the residual matrix. Linear regression is then applied to relate the principal components to the target:
PCR is a linear method: both the dimensionality reduction and the regression step are linear transformations of the original spectra. Importantly, the principal components are computed without considering the response variable y. While this makes PCR useful for exploratory analysis and noise reduction
Multiple Linear Regression (MLR)
MLR extends simple linear regression to multiple features, modeling the relationship between several spectral variables and the target property:
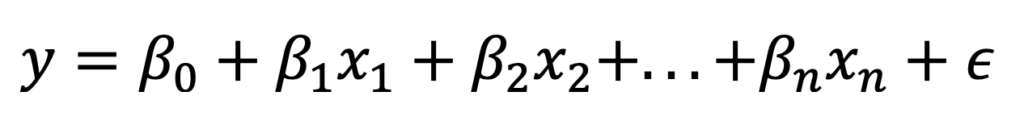
MLR can work well when the number of selected wavelengths is moderate and collinearity is not extreme. In NIR applications, it is often applied after wavelength selection to predict properties like fat, moisture, or API content.
Partial Least Squares (PLS) Regression
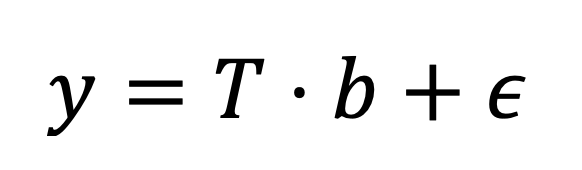
Partial Least Squares (PLS) is a regression technique widely used in NIR spectroscopy that relates spectral data X to a target property Y. It works by reducing the many original spectral variables into a smaller set of latent variables, which are combinations of the original data that best explain both the variation in X and the relationship with Y. The final prediction can be written as:
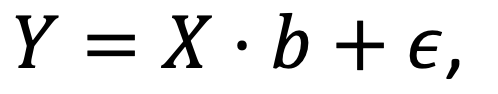
where b are the regression coefficients and ε is the residual error.
Beyond prediction, PLS is also interpretable: it decomposes the data into scores (which describe each sample), loadings (which show how each variable contributes), and residuals (the information not captured by the model), expressed as X = TP’ + E and Y = UQ’ + F. The latent variables from X and Y are linked through a PLS coefficient matrix BPLS, from which the influence of each original variable on the prediction can be derived.
This makes PLS both robust and transparent, allowing scientists to predict fat, protein, moisture, or other chemical components from spectra while understanding which parts of the spectrum drive the results. PLS does not explicitly model nonlinear relationships; instead, it captures linear correlations between spectra and response in a reduced subspace. As such, its success depends on how well nonlinear chemical effects can be approximated by linear combinations of spectral variables.
Nonlinear regression methods
When spectral property relationships deviate significantly from linearity, for example due to light scattering, temperature effects, chemical interactions, or complex sample matrices, nonlinear regression techniques are often more appropriate.
Support Vector Regression (SVR)
SVR introduces nonlinearity through kernel functions that map spectral data into a higher-dimensional feature space. SVR is a nonlinear regression technique that fits a function within a specified margin of tolerance ε . The objective is to find a function f(x) that deviates from the actual target by no more than ε while keeping the model as flat as possible:
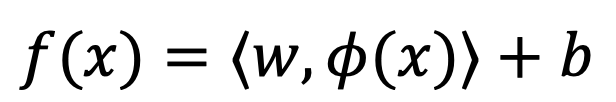
This allows SVR to model complex nonlinear relationships while maintaining good generalization performance, making it well suited for challenging NIR calibration problems.
Neural Networks for Regression
Neural networks model provide a great modeling flexibility by learning hierarchical nonlinear transformations of the input spectra. They are particularly powerful for highly complex systems, though they typically require larger datasets and careful regularization to avoid overfitting. For a simple feedforward network with one hidden layer:
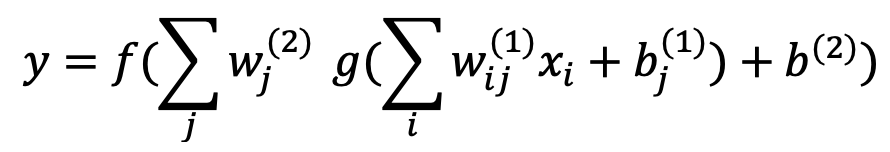
Here, xi are input features (spectral values),wif(1) and wf(2) are weights, bj(1) and b(2) are biases, g is the activation function, and f is the output function.
Neural networks are especially powerful for nonlinear spectral relationships in complex samples, such as plant composition, food quality, or pharmaceutical formulations.
Quantify substances with NIRLAB
Near-Infrared (NIR) spectroscopy, combined with regression algorithms in NIRLAB, provides a powerful method to quantify substances accurately and non-destructively, even accessible directly in the field. Traditionally, measuring chemical or physical properties required transporting samples to a laboratory, which could be time-consuming, costly, and prone to delays.
Regression predicts continuous values, making it ideal for measuring concentrations, compositions, and other critical parameters, often reported in percentages such as moisture, fat, protein, or active ingredient content. By enabling rapid, in-field quantification, NIRLAB transforms how industries monitor quality and optimize production processes.
Food, Feed, and Agriculture

In the food industry, NIR & regression models allow precise measurement of key quality parameters. For instance, a salmon producer can use NIRLAB regression to quantify fat content and pigment levels in living salmon directly in the tank (read more). This rapid, non-destructive testing enabled quality checks throughout the rearing period without the need to transport samples to a laboratory. Similarly, NIR regression can measure sugar content, moisture, or other relevant compounds in processed foods, ensuring consistent quality and compliance with labeling regulations.
Feed producers also benefit from regression models. A livestock feed manufacturer can apply NIRLAB to quantify protein and fiber percentages in different feed batches, allowing optimized formulations and early detection of deviations that could impact animal nutrition.
Agricultural applications extend to crops and soil. A team monitoring olive groves can use NIRLAB ecosystem and regression models to measure moisture content and fat percentages in olives, guiding harvest timing for optimal oil quality (read more). At the same time, soil analysis for nutrient content, organic matter, and moisture levels provided farmers with actionable data to improve irrigation, fertilization, and overall crop performance. By combining crop and soil monitoring, producers can maintain consistent quality from field to finished product.
Types of parameters we can measure with NIRLAB regression (examples, not exhaustive):
| Category | Parameters |
| Food (e.g., meat, olives, dairy) | · Fat · Moisture · Protein · Sugar / starch · Ash / minerals |
| Feed & Forage (e.g., silage, hay, animal feed) | · Protein · Fiber (NDF/ADF) · Moisture / dry matter · Ash / minerals |
| Crops & Soil (e.g., corn, fruits, tubers) | · Moisture · NPK (Nitrogen, Phosphorus, Potassium) · Organic matter / total carbon · Sugar / starch in crops · Chlorophyll / plant pigments |
Controlled substances

Regression combined with the NIRLAB system is a practical, high value approach for quantifying illicit and controlled substances quickly and nondestructively. Instead of a simple “present/absent” result, regression models produce a numerical estimate of an active compound’s concentration within a mixture, typically expressed as a percentage of the sample, which is immediately useful for forensic triage, risk assessment, and laboratory prioritization.
Within the NIRLAB ecosystem there are several application areas where spectroscopy plus regression has proven efficient and reliable:
Narcotics: On-site regression models can estimate the percentage of compounds such as cocaine, heroin, or methamphetamine in seized powders or mixtures.
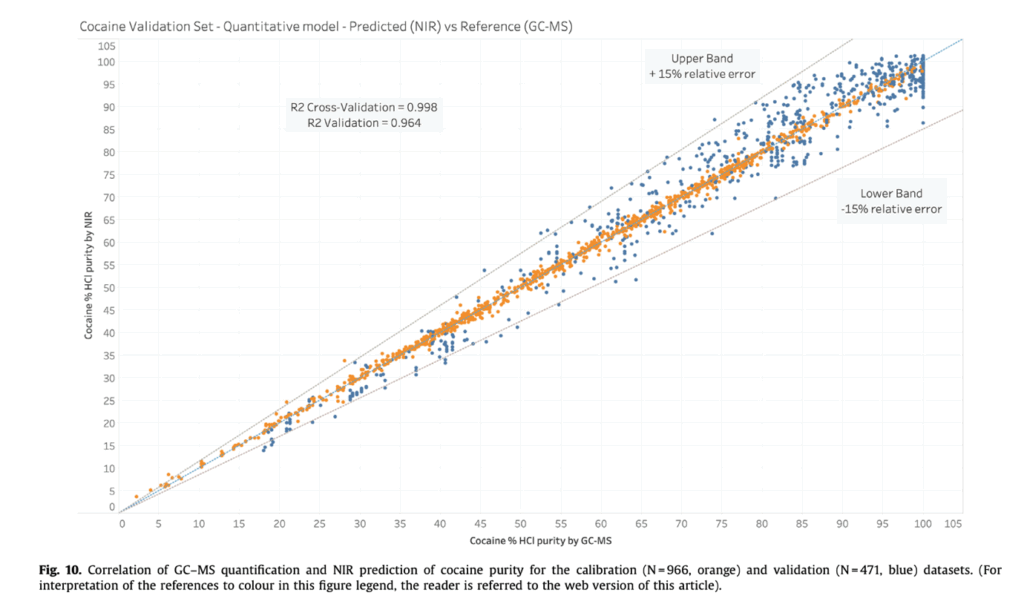
These quantitative results help investigators prioritize high-concentration seizures for urgent analysis while reducing unnecessary transport of low-priority samples (read more). In harm reduction contexts, these measurements also provide valuable insights on potency, helping professionals offer better guidance during consultations (read more).
Active Pharmaceutical Ingredients (APIs): NIRLAB regression enables rapid, non-destructive estimation of API content in tablets, capsules, or powders. Manufacturers can use it for in-process control, while regulators can quickly identify counterfeit or sub-dosage products. For example, suspect sildenafil tablets can be analyzed on-site to determine whether the API content aligns with the labeled dosage, providing a percentage-based estimate that supports quality assurance and regulatory compliance (read more).
Explosive Precursors: Regression models can quantify hazardous precursors, such as concentrated hydrogen peroxide solutions. Rapid, on-site measurements indicate whether the material is being used for legitimate applications or could serve as an explosive precursor (read more). By providing percentage-based concentration estimates, NIRLAB helps first responders make informed decisions about handling, storage, and further analysis, improving safety and operational efficiency.
These regression workflows depend on robust calibration against high‑quality reference methods, appropriate spectral preprocessing, and regular validation. Used properly within established legal and safety protocols, NIRLAB’s quantitative outputs complement confirmatory laboratory tests and materially speed up operational decisions in the field and the lab.
Conclusion
Using regression algorithms, NIRLAB converts spectral data into quantitative, actionable measurements, even in complex or noisy samples. While simple linear regression can work when relationships are strictly linear, NIR spectroscopy often involves high-dimensional and non-linear patterns. NIRLAB leverages powerful machine learning and specialized regression algorithms, such as Partial Least Squares (PLS) and advanced models, to handle these complexities and enable rapid, accurate quantification directly in the field. This allows measurement of moisture, fat, protein, sugar, APIs, narcotics, and hazardous chemicals across diverse applications.
The cloud-based architecture of NIRLAB is key to its performance, providing the computational power and data management needed to apply these algorithms at scale, update models in real time, and deliver results on-site. By turning raw spectral data into measurable, meaningful insights where it matters most, NIRLAB empowers businesses and authorities to make faster decisions, maintain higher quality standards, and ensure safer operations in food and feed production, agriculture, pharmaceuticals, forensic analysis, and hazardous material management.
To learn more about spectroscopy and the full capabilities of NIRLAB’s technology, we invite you to explore our other informative articles [here].
Facing specific challenges in accurately measuring or quantifying substances on-site in your industry? Don’t hesitate to reach out to us at contact@nirlab.com
We are happy to discuss your project and develop a solution tailored to your needs.
More in depth: Zhang W, et al. “A Review of Machine Learning for Near-Infrared Spectroscopy.” MDPI, 2022.